
Get started in three steps

Ready to build your first energy dashboards? Let’s get you up and running with the Rebase Dashboard API quickly and efficiently.

Step 1: Install and authenticate

Install the client

Install the Rebase Dashboard API client with pip:
pip install rebase-dashboard
That’s it! The client is ready to use.

Get your API token

You’ll need an API token to access the Rebase Dashboard API:
  1. Sign up at dash.rebase.energy
  2. Navigate to your account settings
  3. Copy your API token to use in your code

Initialize your client

Now let’s create your API client:
from rebase_dashboard import RebaseDashboardClient

client = RebaseDashboardClient(
    api_key="YOUR_API_KEY",
)

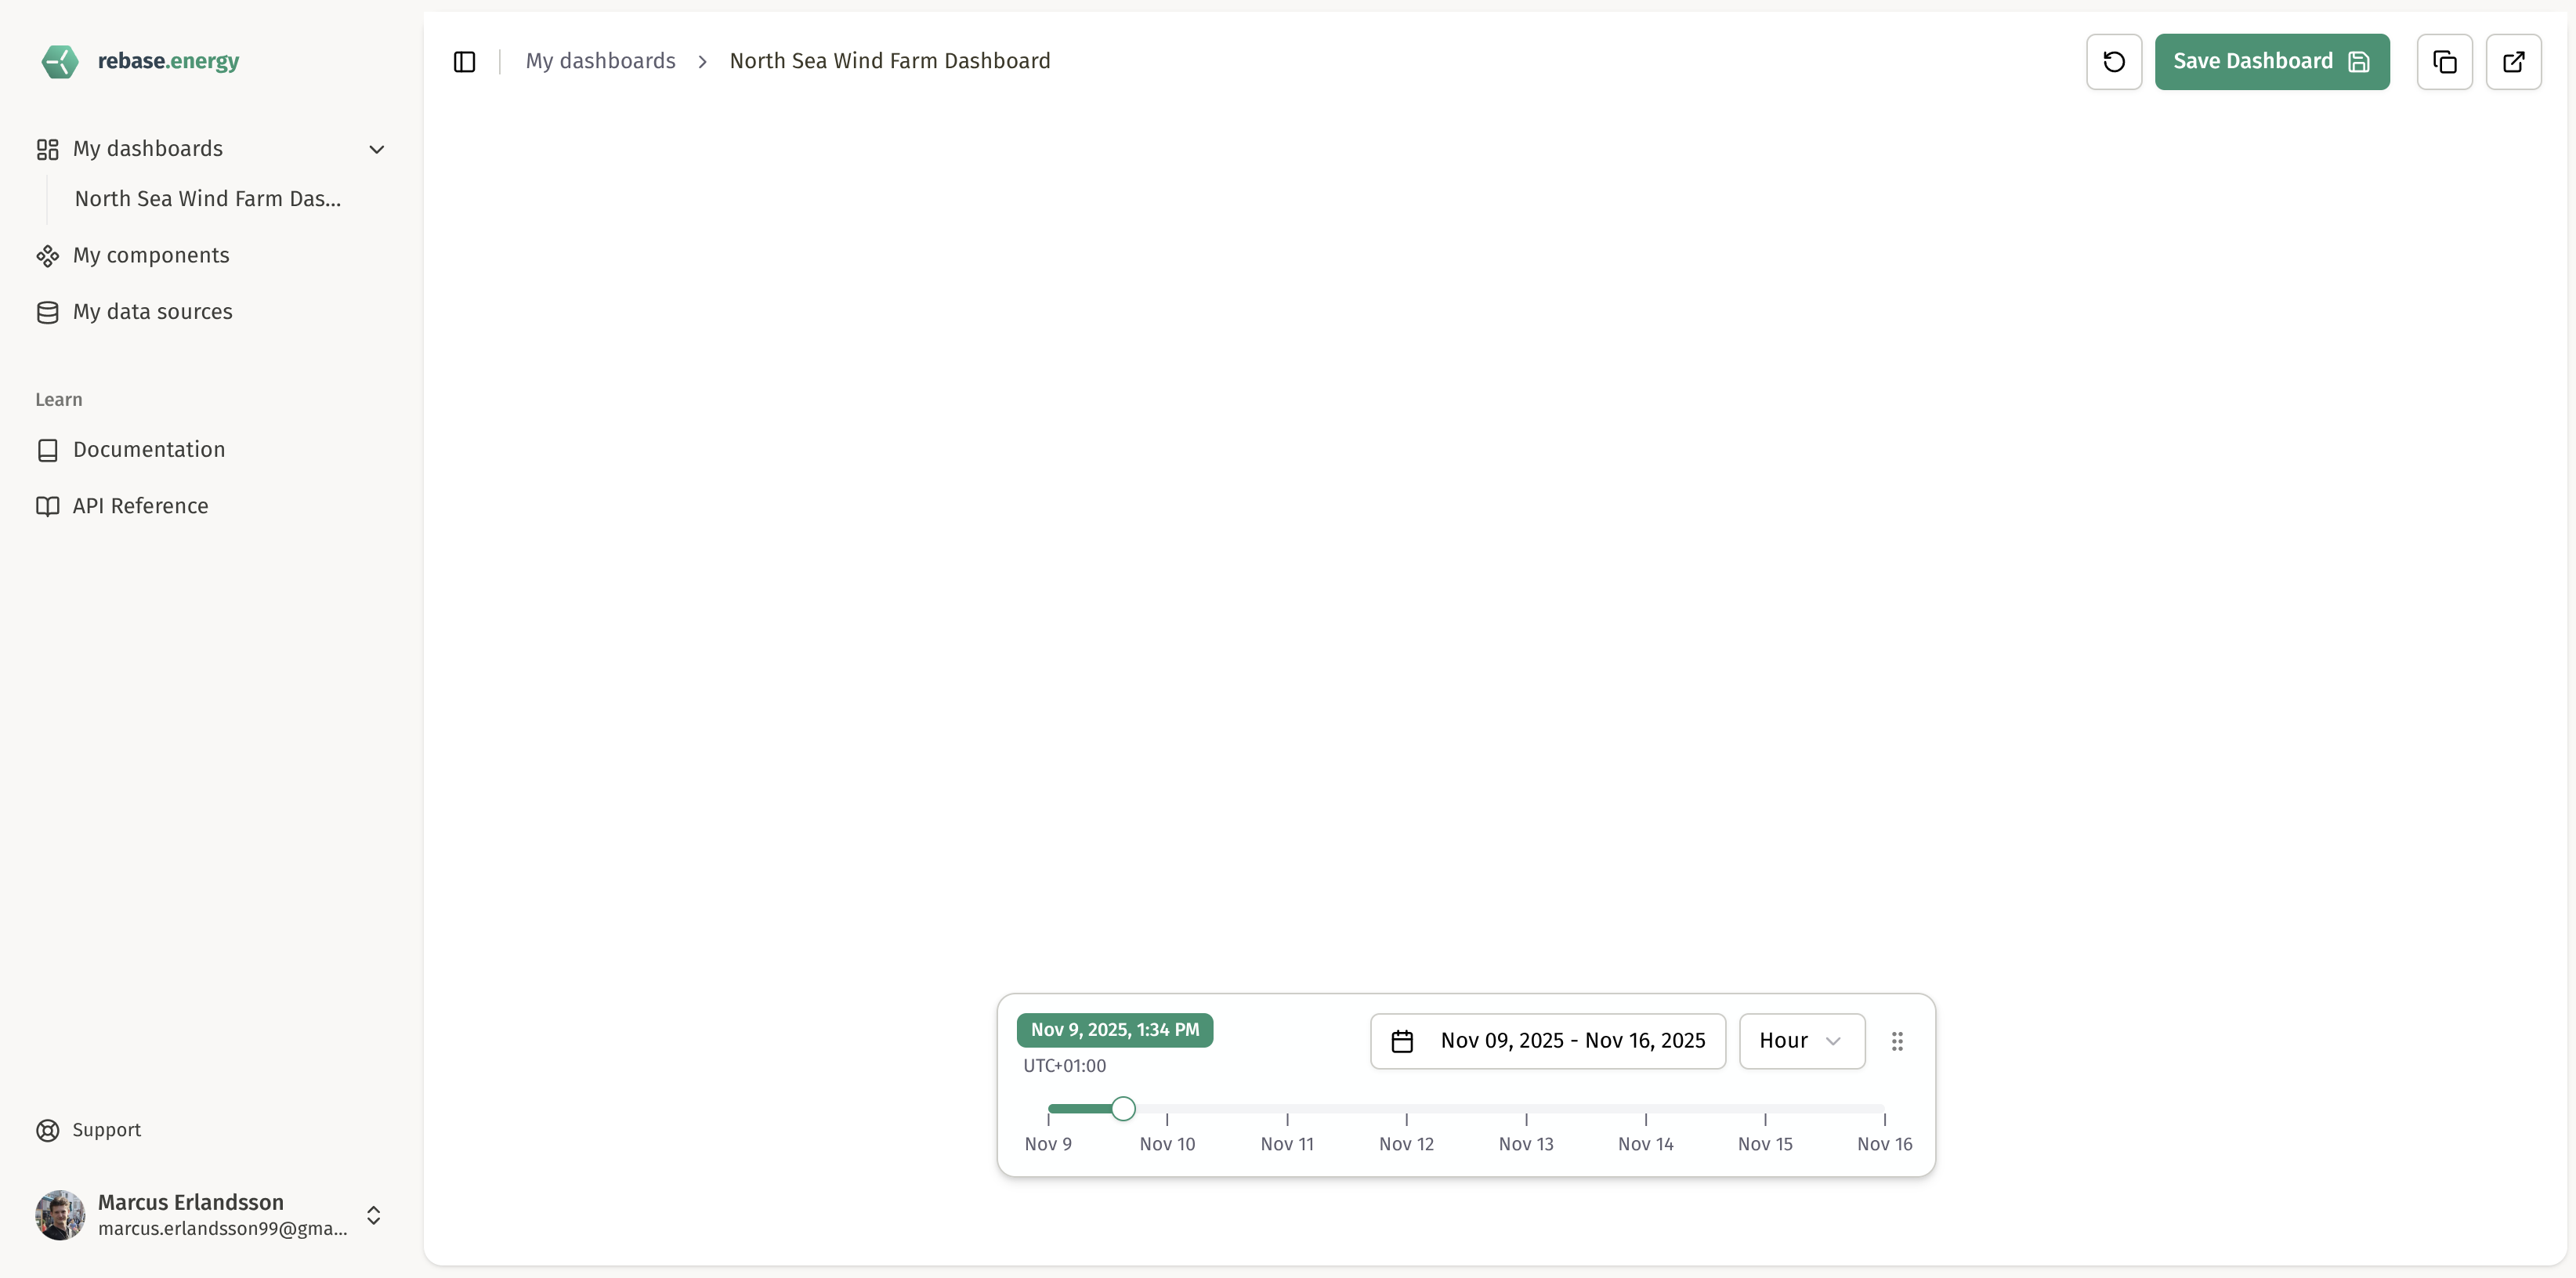
Step 2: Create your first dashboard

Let’s build a complete energy dashboard workflow. We’ll create a wind farm visualization with weather overlays - a comprehensive example that demonstrates the full power of the platform.

2.1 Create a dashboard

Let’s start by creating an empty dashboard that we can build upon:
# Create the dashboard
dashboard = client.dashboards.create_dashboard(
    name="North Sea Wind Farm Dashboard",
    components=[],      # We will create these later on
)

print(f"Created dashboard: {dashboard.id}")
You can now go to the dashboard page and see the dashboard you created. When opening it you will see that it is currently empty, so our next step is to add a component to it.
Dashboard appears after creationOpening the empty dashboard

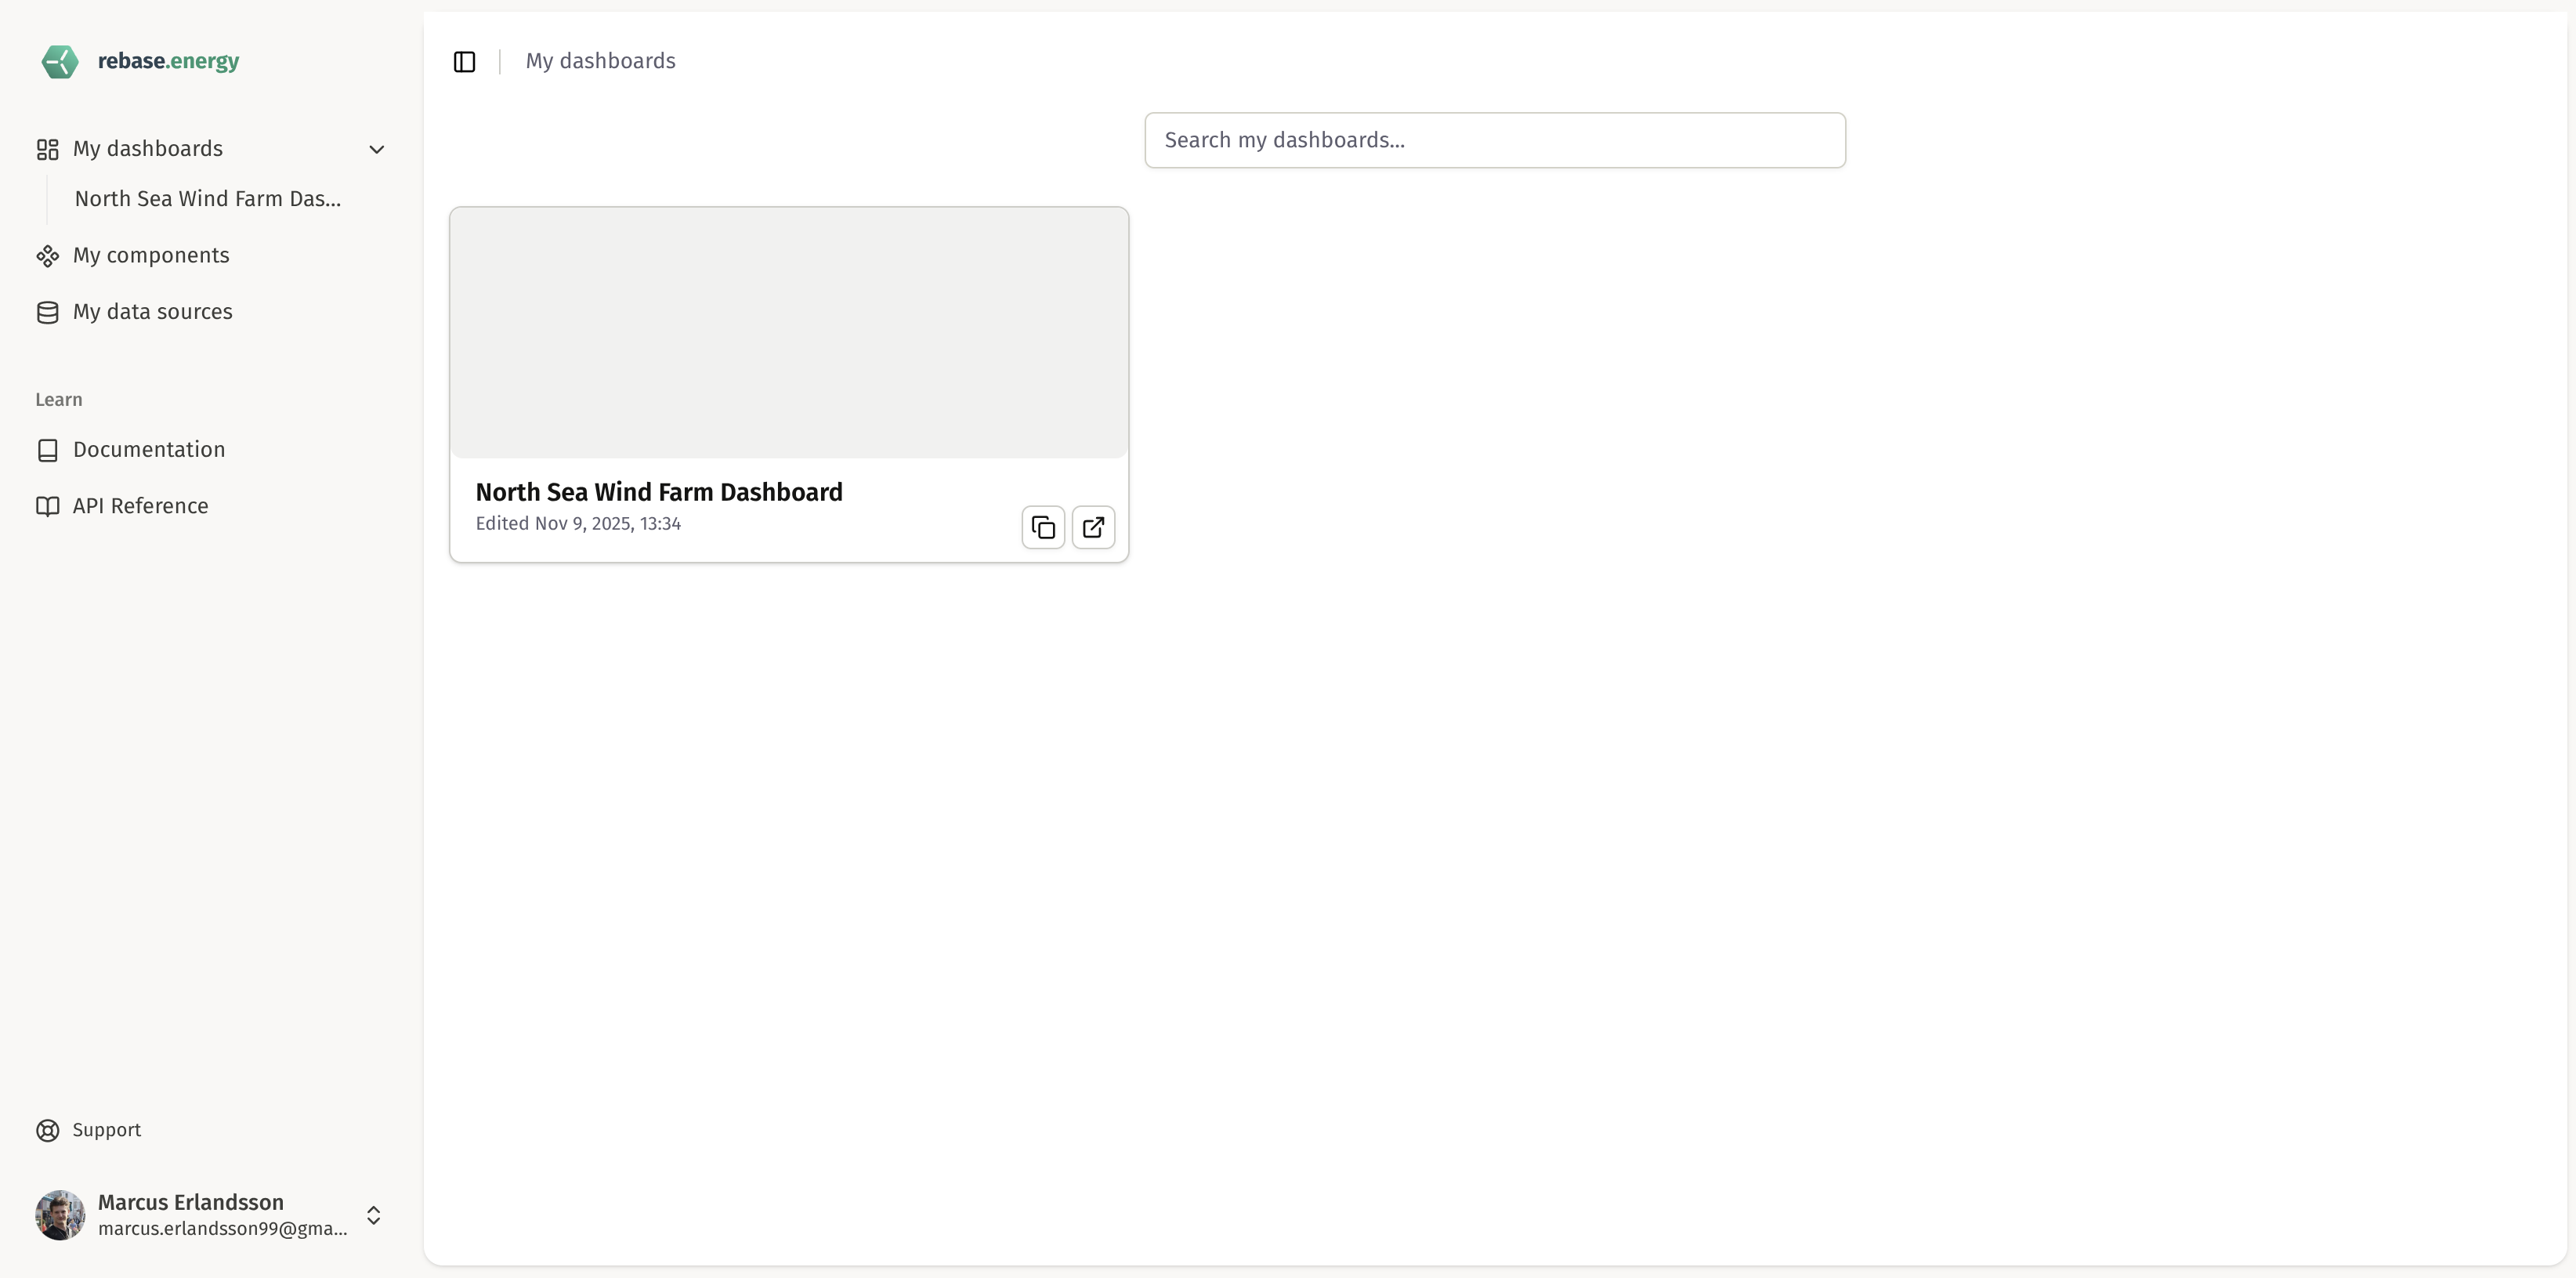
2.2 Create a map component for your dashboard

Let’s begin with a Map component, which can be used to create interactive visualizations with weather data, wind farms and more:
# Create a map component for our dashboard
map_component = client.components.create_map(
    name="Wind Farm Map",
    config={
        "map_style": "mapbox://styles/mapbox/outdoors-v12"
    },
    layer_ids=[]    # We will create these later on
)

print(f"Created map component: {map_component.id}")
Lastly we need to add this new component to our existing dashboard, otherwise it will not be used. We do this using the API update call:
# Add our new component to the dashboard
updated_dashboard = client.dashboards.update_dashboard(
    dashboard.id,
    components=[map_component.id],      # Add the Map Component id here
)
Now if you open your dashboard again, you should see your new map component displayed. In the dashboard you can also drag and rescale your component to fit your use. However, the map component does not have any layers to display at the moment. So our next step is to create Map Layers and Weather Layers to show in your dashboard component. Dashboard with map component added

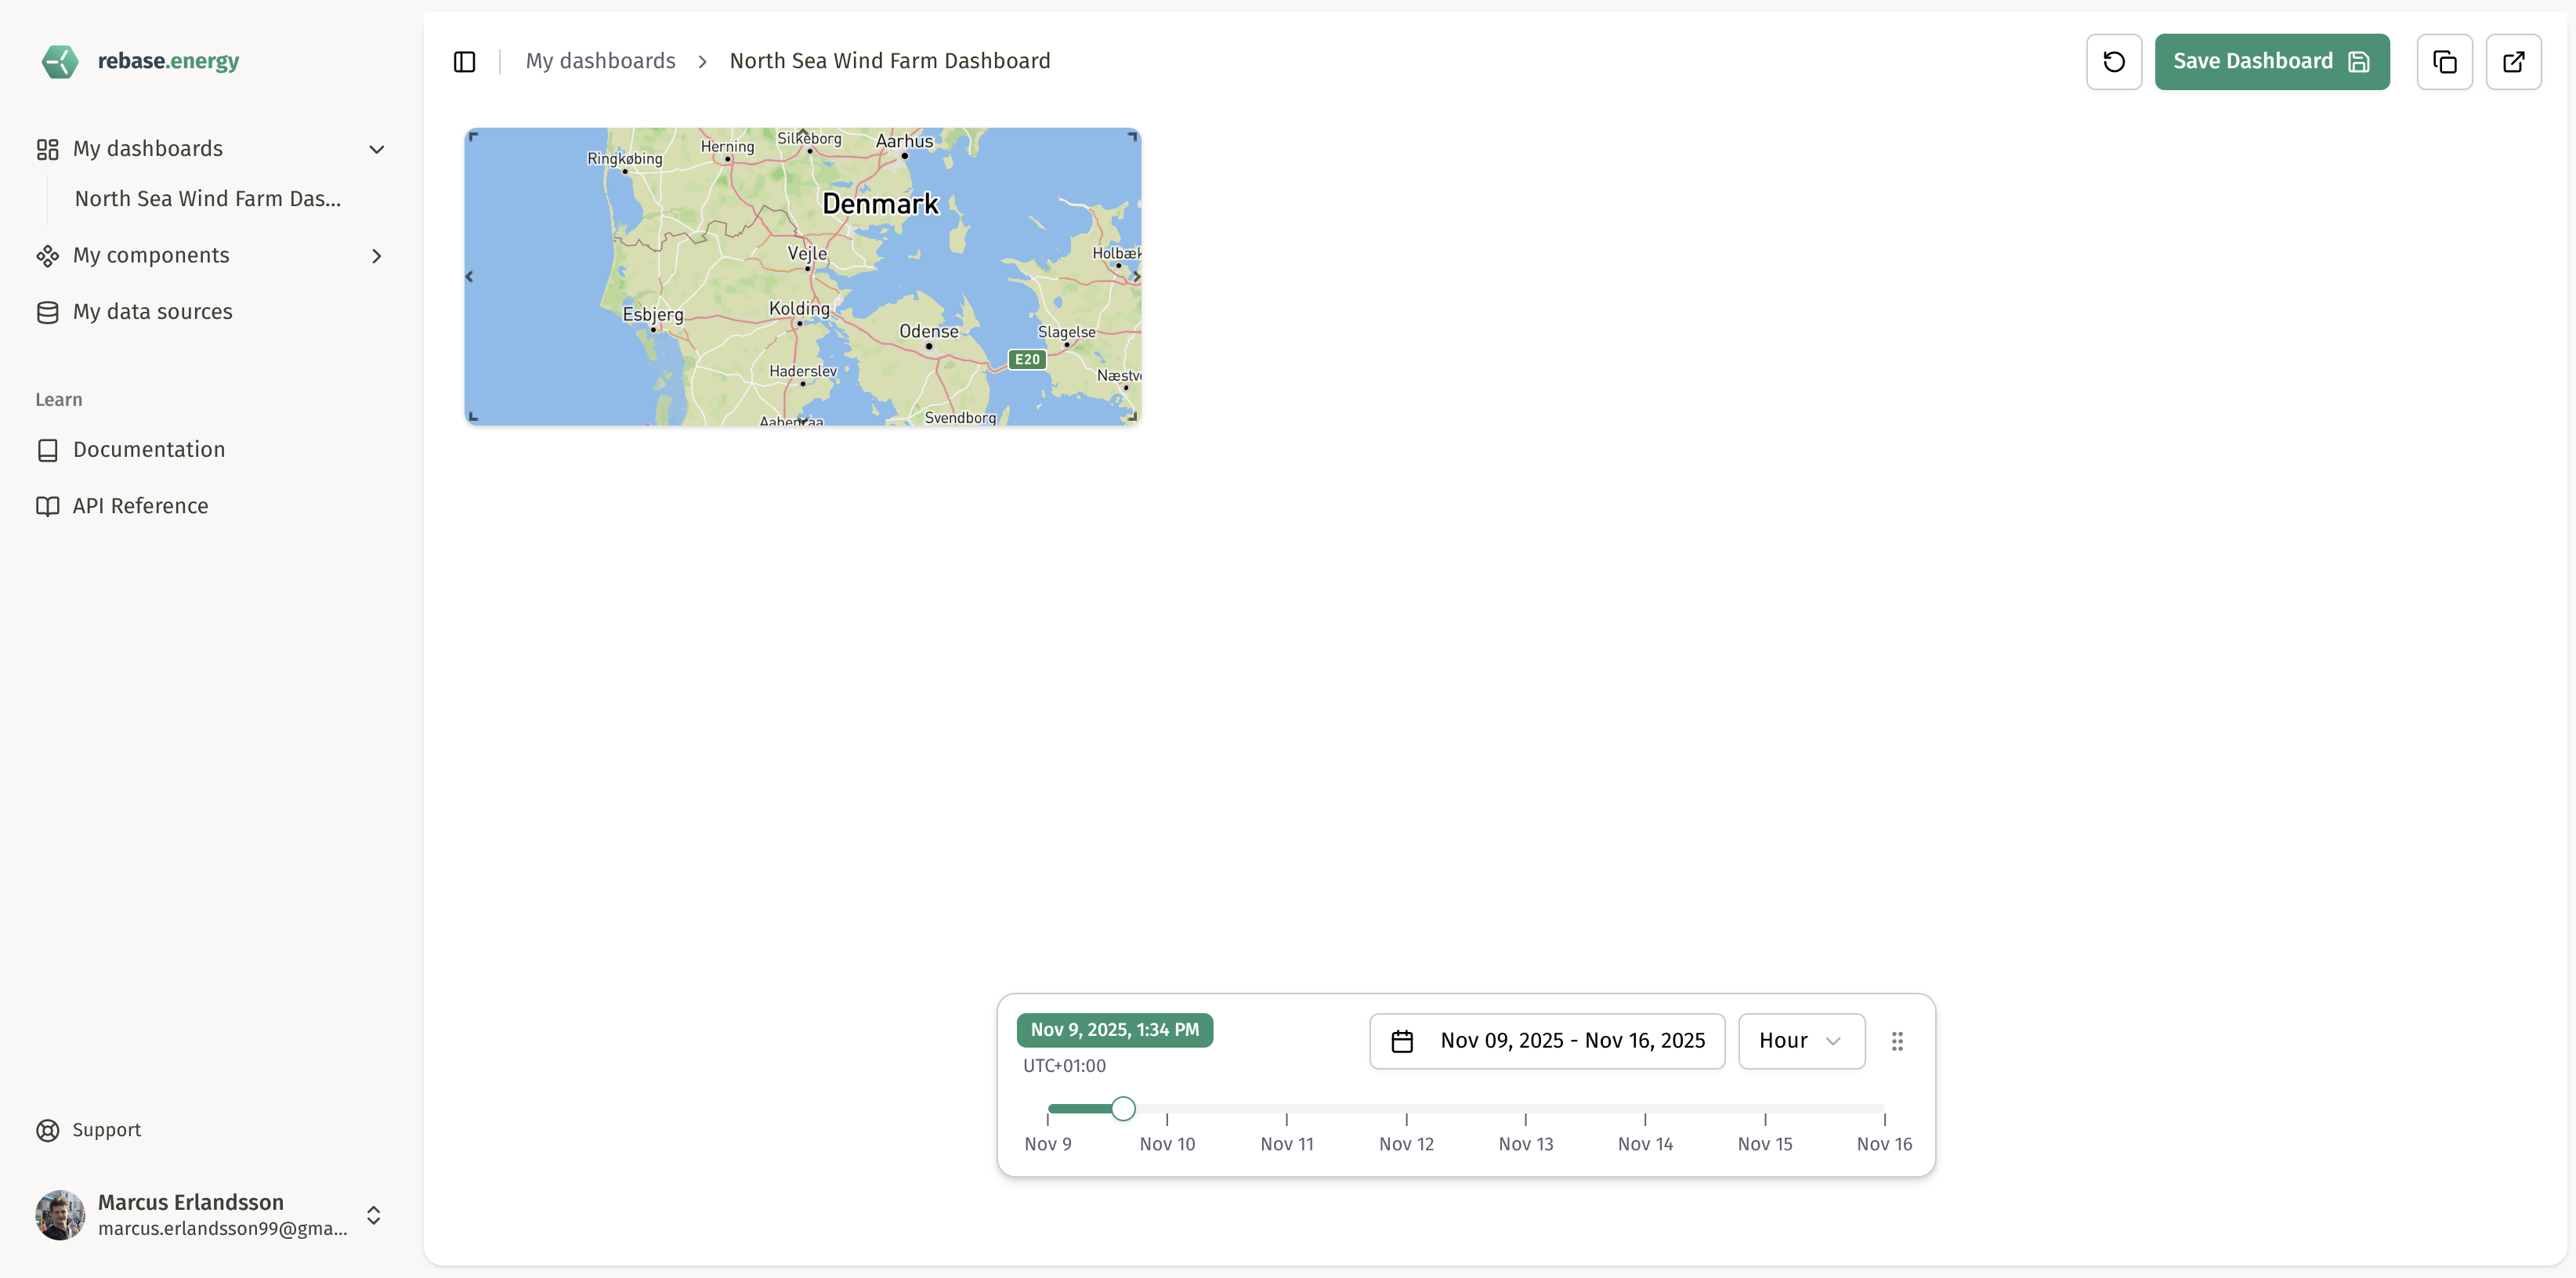
2.3 Create layers for the map component

Layers can be customized to visualize many different types of data and information. Let’s begin by creating a layer for wind data which we can then display with our existing map component:
# Create a weather layer for wind speed
wind_speed_layer = client.layers.create_layer(
    name="Wind Speed at 10m",
    type="wl:RasterLayer",
    weather_model_id="ECMWF_IFS",
    variable="WindSpeed",
    altitude=10,
    run_day="latest",
    run_hour="0",
    deckgl_props={
        "opacity": 0.7
    }
)

print(f"Created weather layer: {wind_speed_layer.id}")
Next, let’s create a layer showing our windfarms. To do this, we first need to create a dataset with the data for our windfarms:
# Create a geospatial dataset for wind turbines
geospatial_dataset = client.datasets.create_geospatial_static(
    name="North Sea Wind Farm",
    data=[
        {
            "position": [3.5, 55.2],
            "properties": {
                "turbine_id": "T001",
                "capacity_mw": 8.0,
                "status": "operational"
            }
        },
        {
            "position": [3.6, 55.3],
            "properties": {
                "turbine_id": "T002",
                "capacity_mw": 8.0,
                "status": "operational"
            }
        },
        {
            "position": [3.4, 55.1],
            "properties": {
                "turbine_id": "T003",
                "capacity_mw": 8.0,
                "status": "maintenance"
            }
        }
    ],
    description="Wind turbine locations in the North Sea",
    metadata={
        "region": "North Sea",
        "country": "Netherlands",
        "total_capacity": "24 MW"
    }
)

print(f"Created dataset: {geospatial_dataset.id}")
Next, to visualize those turbines on our map we create a new layer for them. This layer is similar to the one we made previously for wind data, but instead of information for weather data models we will specify the type as a “ScatterPlotLayer” and add the id for the dataset we just created:
# Create a scatterplot layer for wind turbines
wind_turbines_layer = client.layers.create_layer(
    name="Wind Turbines Layer",
    type="ScatterPlotLayer",
    dataset_id=geospatial_dataset.id,
    deckgl_props={
        "getFillColor": [0, 255, 0],
        "getLineColor": [0, 200, 0],
    }
)

print(f"Created map layer: {wind_turbines_layer.id}")
Finally, for these two new layers to show up in our Map component, we also need to add their layer IDs to the component. We do this by updating the map component with the “update” API call:
# Update the map component with our new Weather Layer
updated_map_component = client.components.update_map(
    map_component.id,
    layer_ids=[wind_speed_layer.id, wind_turbines_layer.id]    # Add your Layer ids here
)

print(f"Updated map component: {map_component.id} with Weather Layer: {wind_speed_layer.id} and Turbine Layer: {wind_turbines_layer.id}")
Now if you go back to your dashboard, you will see the layers displayed: Dashboard with layers added, before resizing You can also drag the map component to give it the size and position that suits your needs: Dashboard with layers added, after resizing

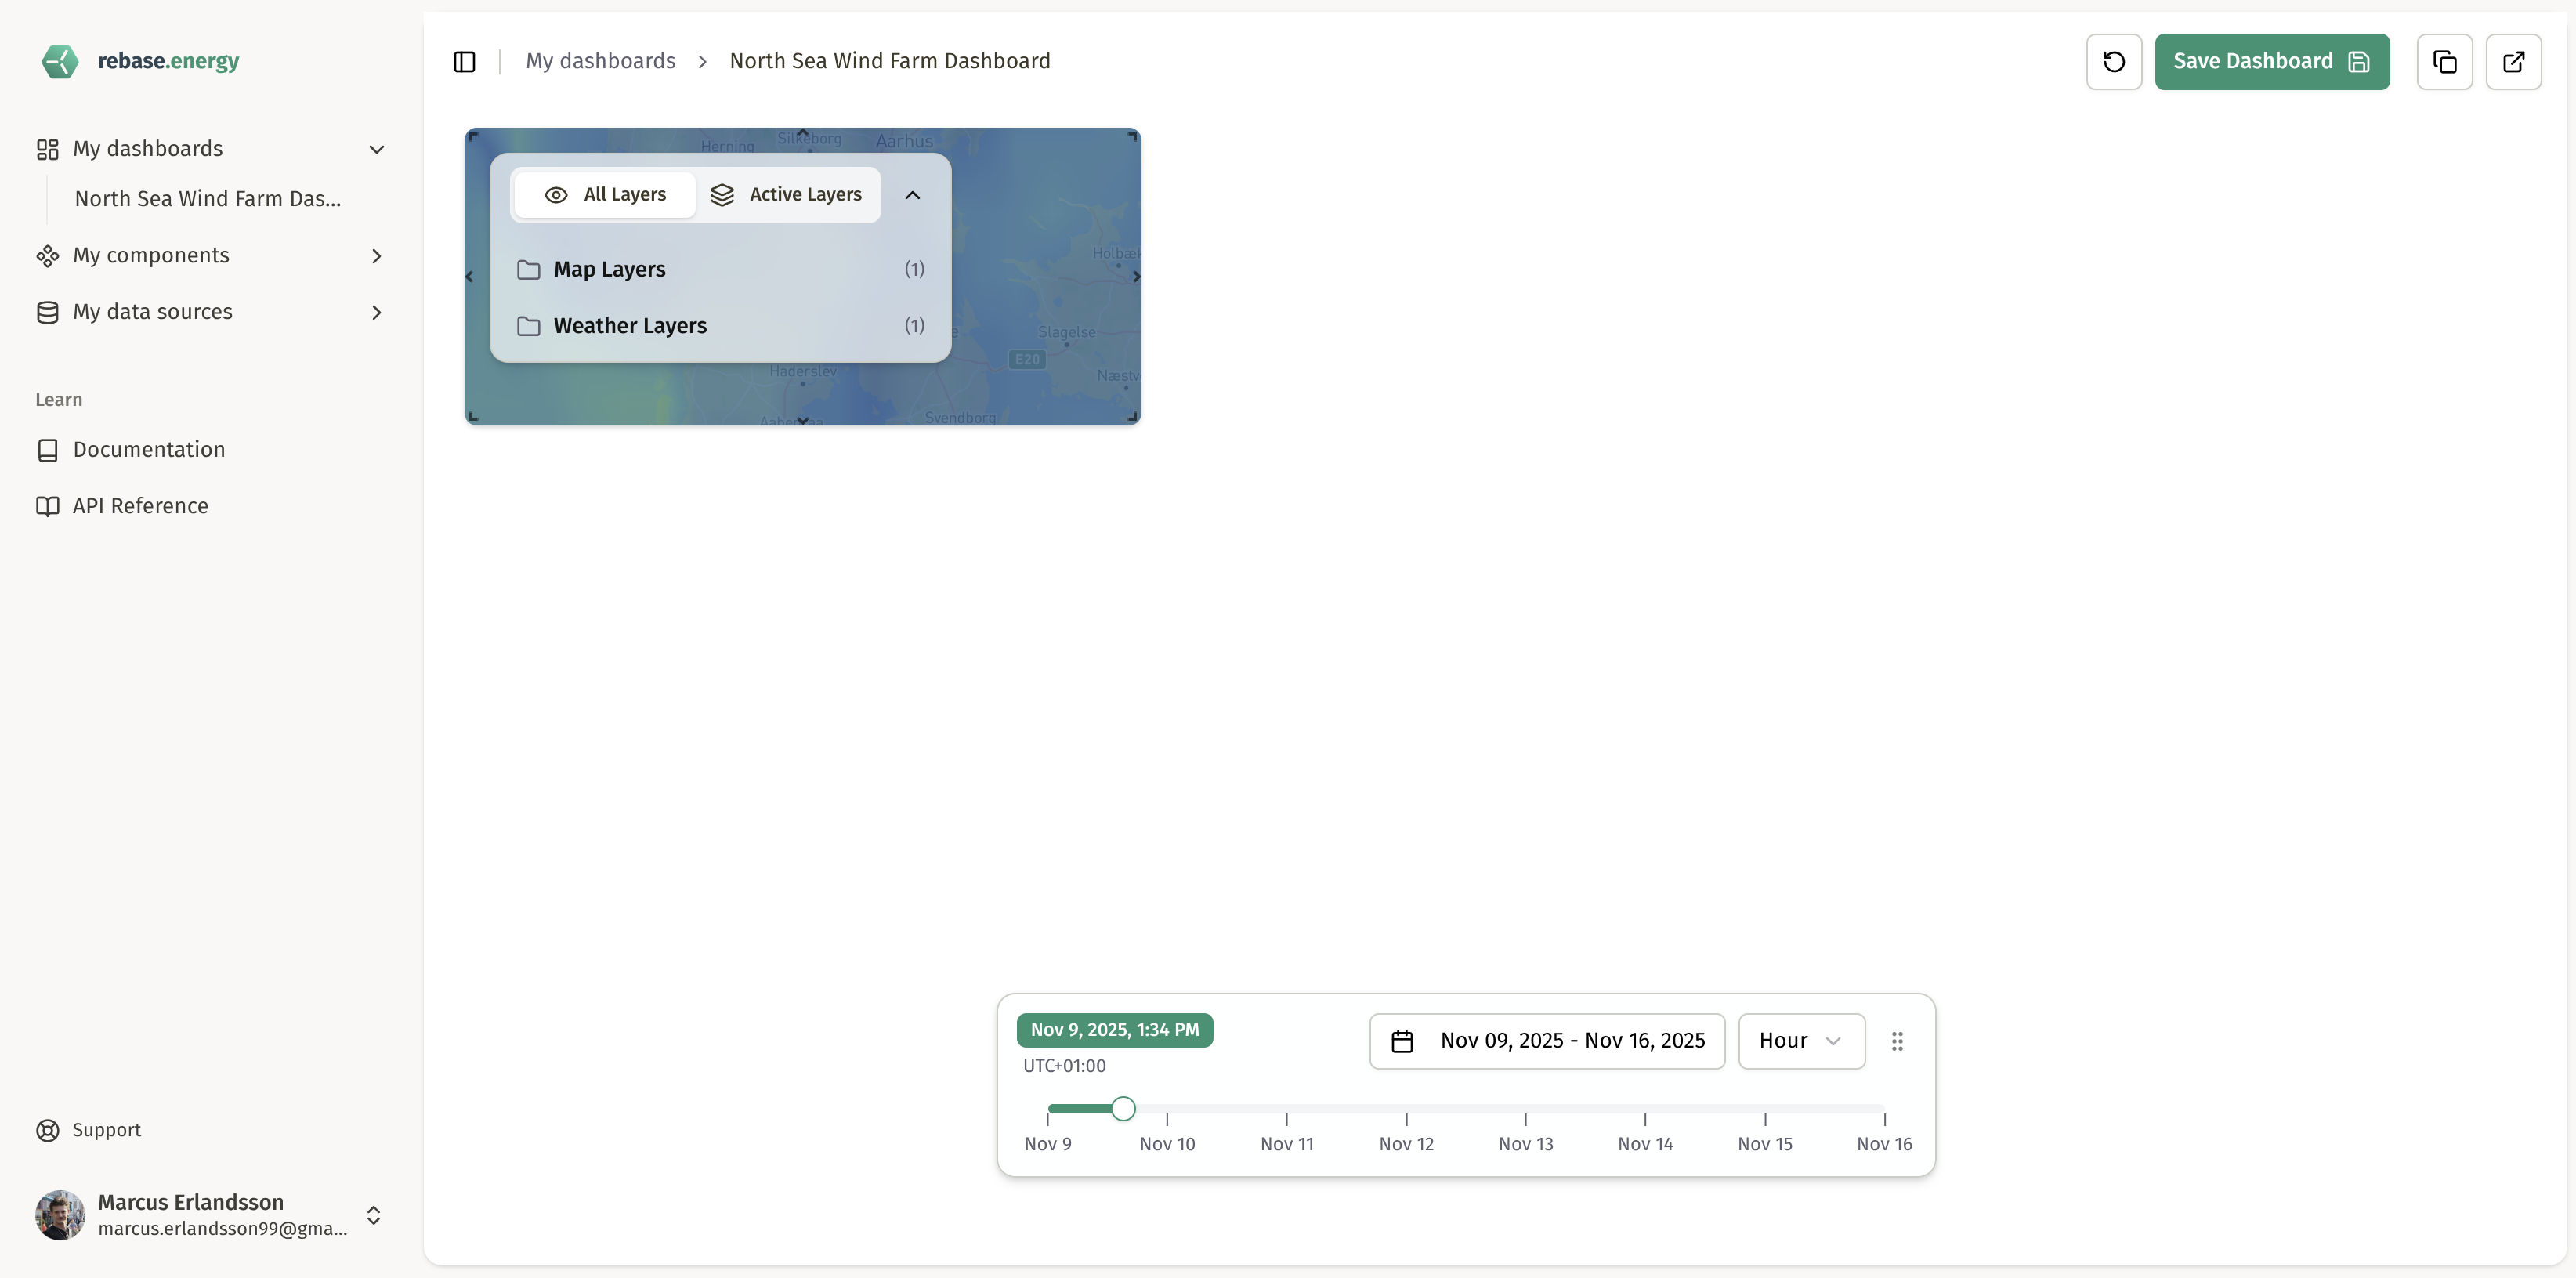
Step 3: View your dashboard

Access your dashboard

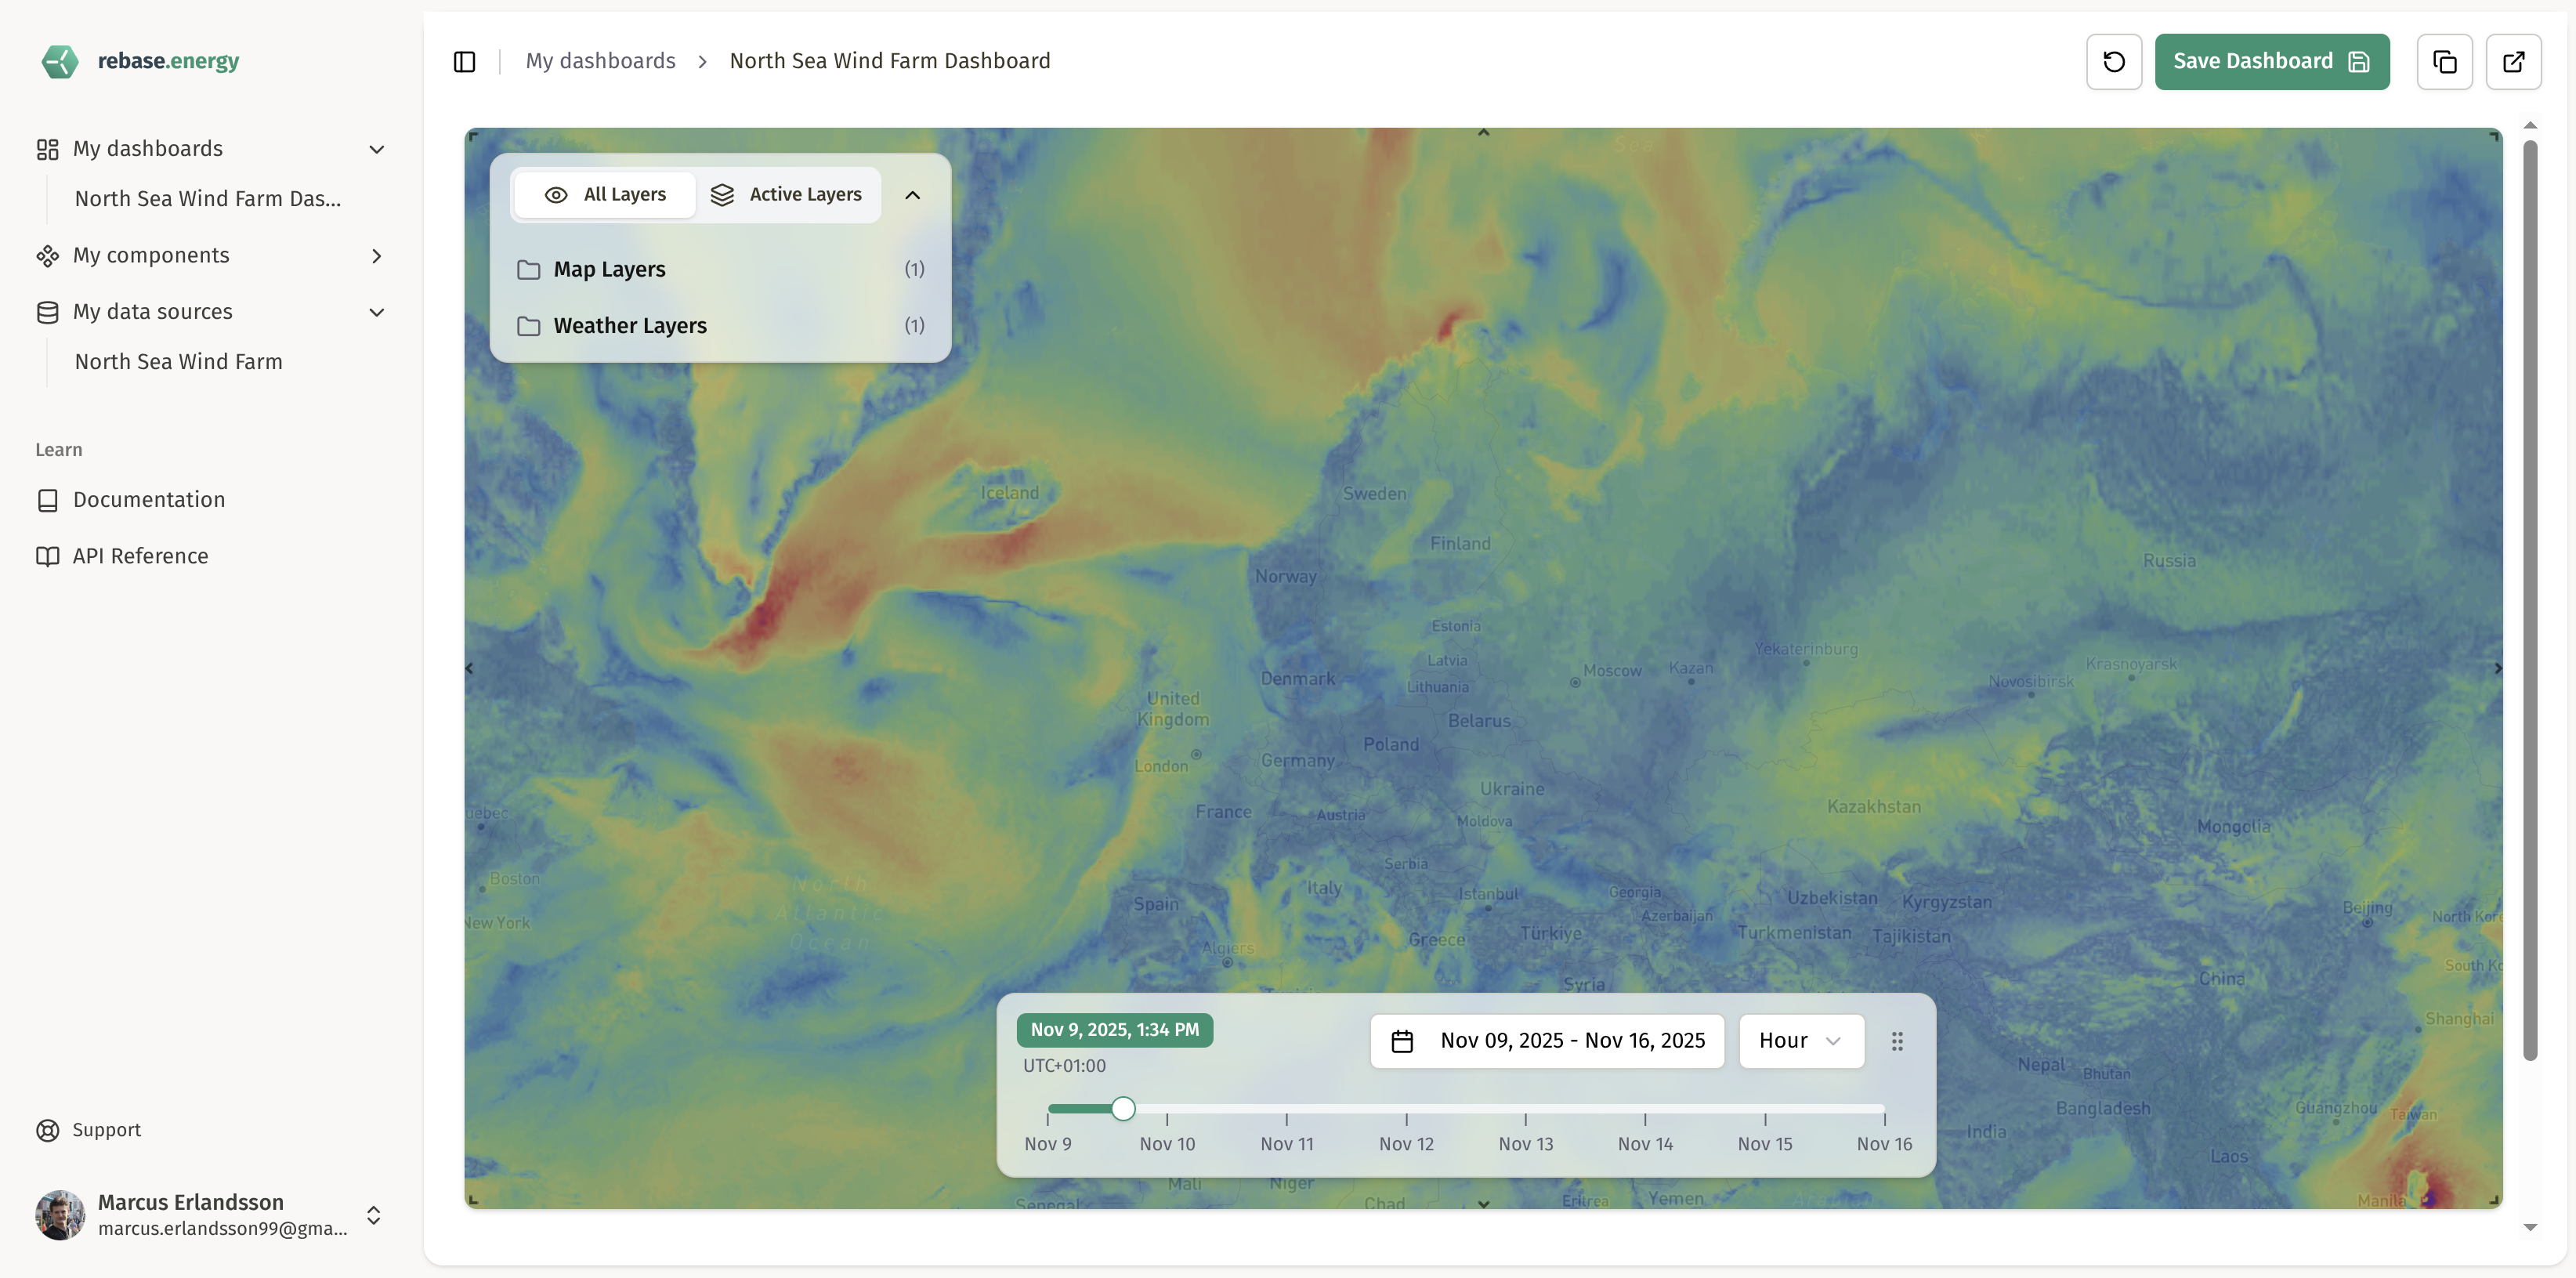
Your dashboard is now live! Open it in your browser:
https://dash.rebase.energy
Once on the web page, log in with your Rebase account and start exploring your new dashboard.

Customize your dashboard

You can now:
  • Drag and drop components to rearrange the layout
  • Customize chart colors and styling with ECharts options
  • Adjust map styles and layer properties
  • Add more datasets and components
Try customizing the chart colors or changing the map style to see the updates!

Key concepts you just learned

Now that you’ve built your first dashboard, learn more about the concepts you just used:
Need help? Check out our full API documentation or join our community for support and examples.